With contributions from Jonathan Schwantes, Senior Policy Counsel, Consumer Reports
Over the past 18 months the COVID-19 pandemic has dramatically, and in many respects permanently, altered our lives. Among the painful lessons of this period are two interrelated realizations.
One, many vital elements of our lives, including work, education, and healthcare, are increasingly dependent on fast, reliable broadband internet service. This 21st-century reality is reflected in a recent nationally representative Consumer Reports (CR) survey of 2,514 US adults finding that 76 percent of Americans agree that internet service is as important as water and electricity.
Two, millions of Americans lack access to or struggle to pay for such service. While a nationally representative June 2021 CR survey of 2,565 US adults found that 77 percent of Americans who currently have home broadband say they are at least “somewhat satisfied” with their service, 23 percent of Americans in the same survey said they either lacked home internet service altogether (3%) or rely on a smartphone (15%) or slow DSL or dial-up service (5%) for internet access. The survey also found that 24 percent of Americans who do have broadband service in their household found it difficult to afford their monthly internet bill.
The absence of competition and government oversight are often cited as reasons for poor internet access and high prices. What little government regulation once existed in the broadband internet market was stripped away in 2018, when the Federal Communications Commission (FCC) repealed its net neutrality rules, and the regulatory framework to oversee internet service providers (ISPs) and protect consumers along with it.
To make matters worse, the broadband internet market is not competitive, leaving millions of consumers stuck with only one choice of provider. According to the FCC, more than 87 million Americans enjoyed only one choice for the minimum threshold of broadband service (25 Mbps download, 3 Mbps upload speeds or 25/3), and that number increased as broadband speeds available increased. For example, 52 percent of the population has only one choice of ISP that can deliver 250/25 Mbps service.
Amid this backdrop, CR set out to learn how consumers felt about the business practices of their ISPs during this critical time. To this end, we initiated a Share Your Story campaign on the CR website, posing the following questions:
- Do you think what you pay for internet is fair for the service/speed you are receiving?
- Who provides your internet service?
- Do you have choices for internet service, or are you stuck with one company?
- If there is no broadband internet service offered in your area, how do you get online?
- Can you tell us how important high-quality internet service has been to you during the pandemic?
More than 1,000 CR members responded, providing their state, city and ZIP code information along with narrative accounts of interactions with their broadband providers. These voluntary responses have not been fact checked by Consumer Reports for accuracy, and reflect only the views and experiences of CR members who chose to participate. They are not necessarily representative of nationally-held attitudes or the views of all CR members.
In order to assess the stories submitted by respondents, we employed natural language processing and advanced statistical topic modeling using an RShiny app designed by CR’s Statistics & Data Science team (the CR Topic Modeler) to investigate and quantify the responses. We were able to discern patterns in the frequency of the specific issues and problems raised and in the geographic locations in which they occurred. The findings in detail are discussed below.
CR gave broadband providers an opportunity to respond to the findings below. Two provider trade groups, USTelecom and NCTA (the Internet and Television Association), noted the overall high satisfaction levels found by CR’s June 2021 survey (as noted above). In addition, a spokesperson for USTelecom, a trade group of telephone companies that also provide internet service, wrote that broadband providers have effectively responded to increased demand for connectivity during the COVID-19 pandemic, ensuring continued access in part by investing almost $80 billion in their networks in 2020. NCTA, a trade group of large cable TV and broadband providers, also pointed to the industry’s efforts to maintain access during the pandemic, including participation in a range of programs designed to expand access for low-income households. ACA Connects, a trade group of small cable TV and broadband, declined to comment.
Sentence Level Analysis:
Because the submitted narratives often address multiple issues, the CR Topic Modeler separates them into individual sentences and then scrutinizes each sentence for themes and topics. The app also uses natural language processing and a sentiment lexicon developed by Bing Liu and collaborators to determine the sentiment of each sentence—whether, for example, it describes something in a positive or negative manner. In all, the stories studied contained nearly 5,000 sentences.
Figure 1 shows a “word cloud” generated by the results, with positive words displayed in green and negative ones in red. The size of a word is proportional to the frequency with which it appeared in the corpus of stories.
Figure 1: Sentiment Word Cloud
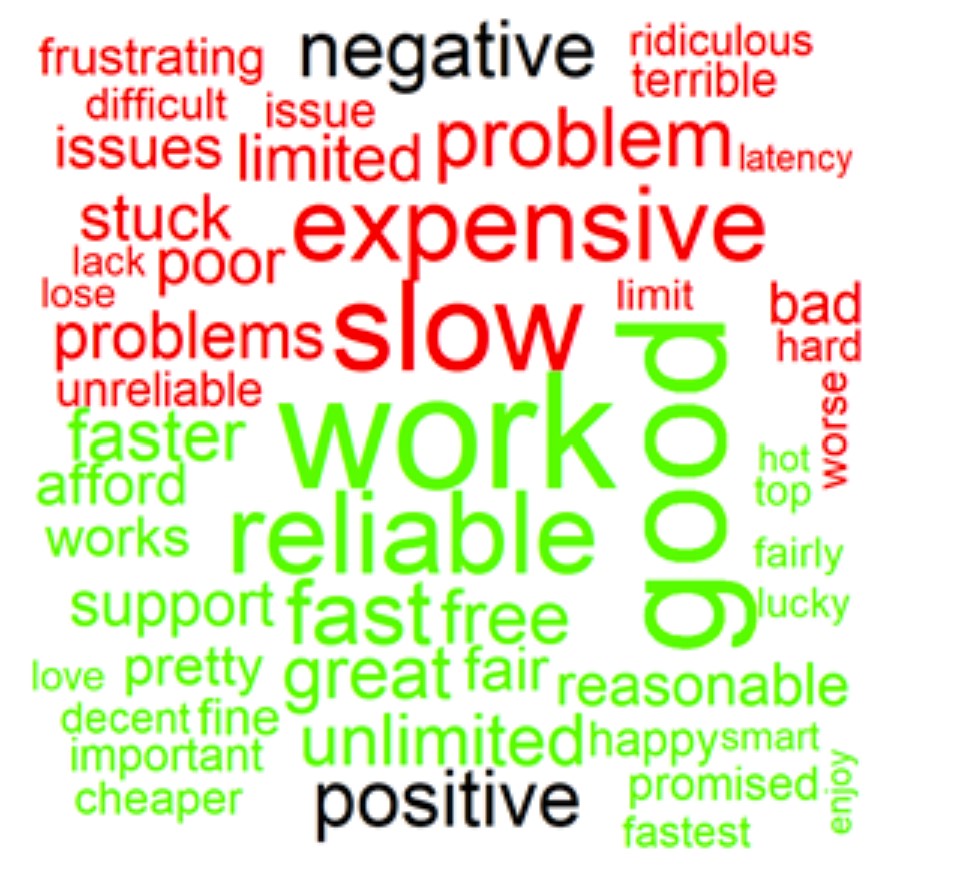
Figure 2 is a bar chart representing the range and frequency of issues reported by CR members who shared their stories. The bars show the number of unique sentences that address each of the major issues, such as pricing and connectivity limitations, and the percentage of all the sentences that those numbers represent. In all, 2,644 of the approximately 5,000 sentences addressed one of the major issues shown in Figure 2.
Note that in some cases multiple sentences addressing a single major issue appeared in the same consumer narrative. For example, a narrative might mention a pricing discrepancy in one sentence and a promotional credit in another sentence—in which case, the story would be counted as two instances of the major issue of pricing. As such, a single story may have been counted in multiple bars. Figure 2 also shows representative quotes color-coded to the corresponding major issue.
Figure 2: Frequency of Mentions of Specific Issues
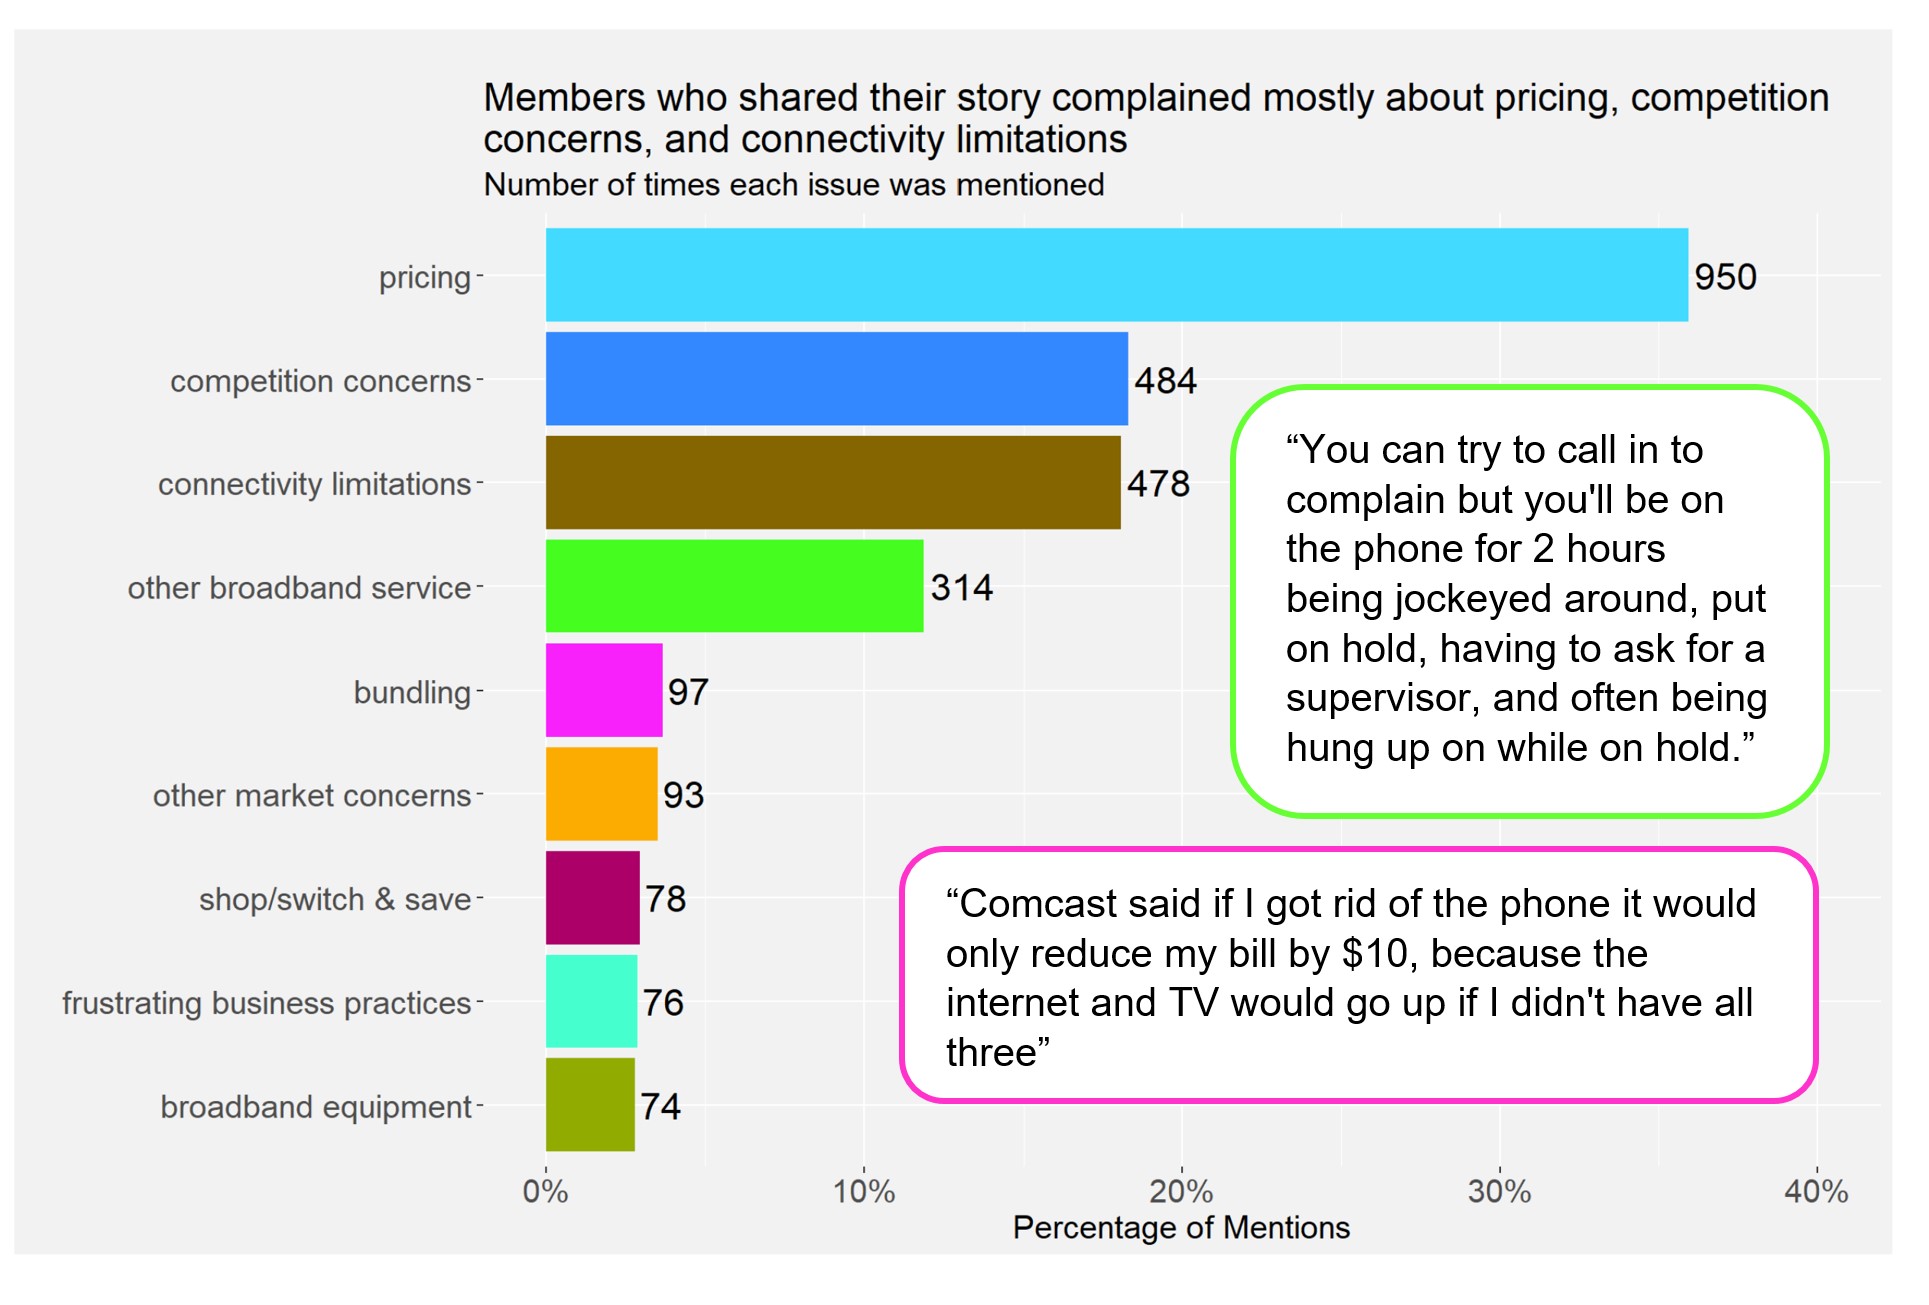
Table 1 contains a list of the nine most prevalent major issues CR identified, together with the associated sub-issues and terms being discussed. Note that although the overwhelming majority of stories described negative experiences, some consumers shared positive feelings about their ISP.
Table 1: Major issues and associated sub-issues and terms
| Major Issues | Sub-issues and terms |
|---|---|
| pricing | overpriced, monthly rate (members mention their monthly charges), continually rising, promotional credit, nickel-and-diming, persistent negotiation, no transparency, pricing discrepancy, autopay discount |
| competition concerns | monopoly, limited competition |
| connectivity limitations | poor connectivity, data caps, tethering, network congestion |
| other broadband service | poor customer service, limited service (practices that create unequal access to technology services in geographical areas, such as when internet service providers decide to not service specific geographic areas because they are perceived to be not as profitable), paid unused service (no option to drop unwanted channels), customer loyalty penalized |
| bundling | questionable bundling scheme, use bundle (members mention using bundling) |
| other market concerns | regulatory oversight (members want broadband service to be a public utility, not a private enterprise), cities taking initiative |
| shop/switch & save | drop service (members mention dropping service), other streaming options (members shopping around for other options like Hulu, YouTube TV, etc.), savings (mentions of members saving from switching ISPs or shopping around) |
| frustrating business practices | confusing advertising (advertising of discounted services is vague and misleading to the average consumer), arbitrary business activities (disconnecting service without warning, digging up lawn to lay down cable without homeowner’s approval), other anti-consumer behaviors (charging for services not offered, forcing members to upgrade) |
| broadband equipment | unit rent mandatory (members are forced to rent router, modem), unit owned (these members own their own units), unit cost (monthly unit rent), outdated unit (ISPs do not maintain their equipment), unit borrowed, faulty security equipment (home security service provided by ISPs is insufficient) |
Story Level Analysis:
In the previous section, we discussed the issues and counts corresponding to individual sentences, e.g., the counts shown in Figure 2 are counts of sentences rather than counts of stories. These counts do not necessarily represent unique stories; refer back to the discussion of Figure 2 for more detail.
Here we aggregate the sentence level analysis into a review level analysis so the corresponding counts are counts of unique stories. Below we detail the top three main issues expressed by the CR members who shared their stories by emphasizing several of the sub-issues associated with the main issues.
Major Issue 1: Pricing
The issue addressed most frequently by the respondents was internet pricing. At least 49 percent of CR members who shared their stories felt that monthly internet service is too expensive, with many complaining that rates have been increasing at an accelerating pace during COVID without a reasonable explanation from the ISPs. Click on the soundbite below to hear from CR member, Virginia Madsen, in her own words from California.
“I had Spectrum for internet/TV/Landline. Last year my bill went up $20 without notice. The bill rose to $200/month. I had no premium channels either. I called them to find out why. They told me that I was no longer a Time Warner customer and those were the Spectrum rates. I was not happy and asked them if my bill could be reduced. They offered me no reduction and in fact told me my bill would go up over $100 in the next year!! Yes they told me that!”
“I subscribe to Suddenlink cable (internet only, no TV bundle, no modem rental, no wifi provided by Suddenlink), with no cap on data. After the “new customer” “deal ended, I paid $77.49 total monthly starting 11-MAY-2019. Starting 17-FEB-2020 my rate went up to $87.49 total monthly. As of 17-MAR-2021, my current rate is $107.49. That’s just under a 23% increase in 12 months, and just over a 39% increase in less than 2 years. There’s little to no competition in our small town of ~8,000 where the economy is heavily reliant on the oil industry.”
In addition to monthly charges, internet bills contain multiple fees, such as service fees, rental fees, installation fees, taxes, and others, and some respondents reported that such fees make it difficult for them to understand the costs associated with their internet service. Some also complained of being charged extra for using their own equipment rather than renting it from their providers.
Other respondents indicated that misleading advertisements had persuaded them to sign up for what turned out to be unexpectedly expensive services. And some reported that salespeople pressured them into agreeing to extended contracts before fully explaining the details or totaling up the monthly costs.
Many CR members also stated that the reliability of their service decreased even as prices increased.
“We have two options for Internet providers – AT&T and Suddenlink, and they are both awful. I have Suddenlink and they constantly increase their prices while service remains terrible. Connection is unreliable, often slow, and expensive.”
“I use Spectrum for my internet. Every year the price rises with no extra features included. The service can be very slow and causes my streaming service to move at a crawl. Asking for a price decrease is not in the picture. My costs have jumped from $45 a month to $79.00 in less than 3 years. Outrageous. Service is mediocre at best.”
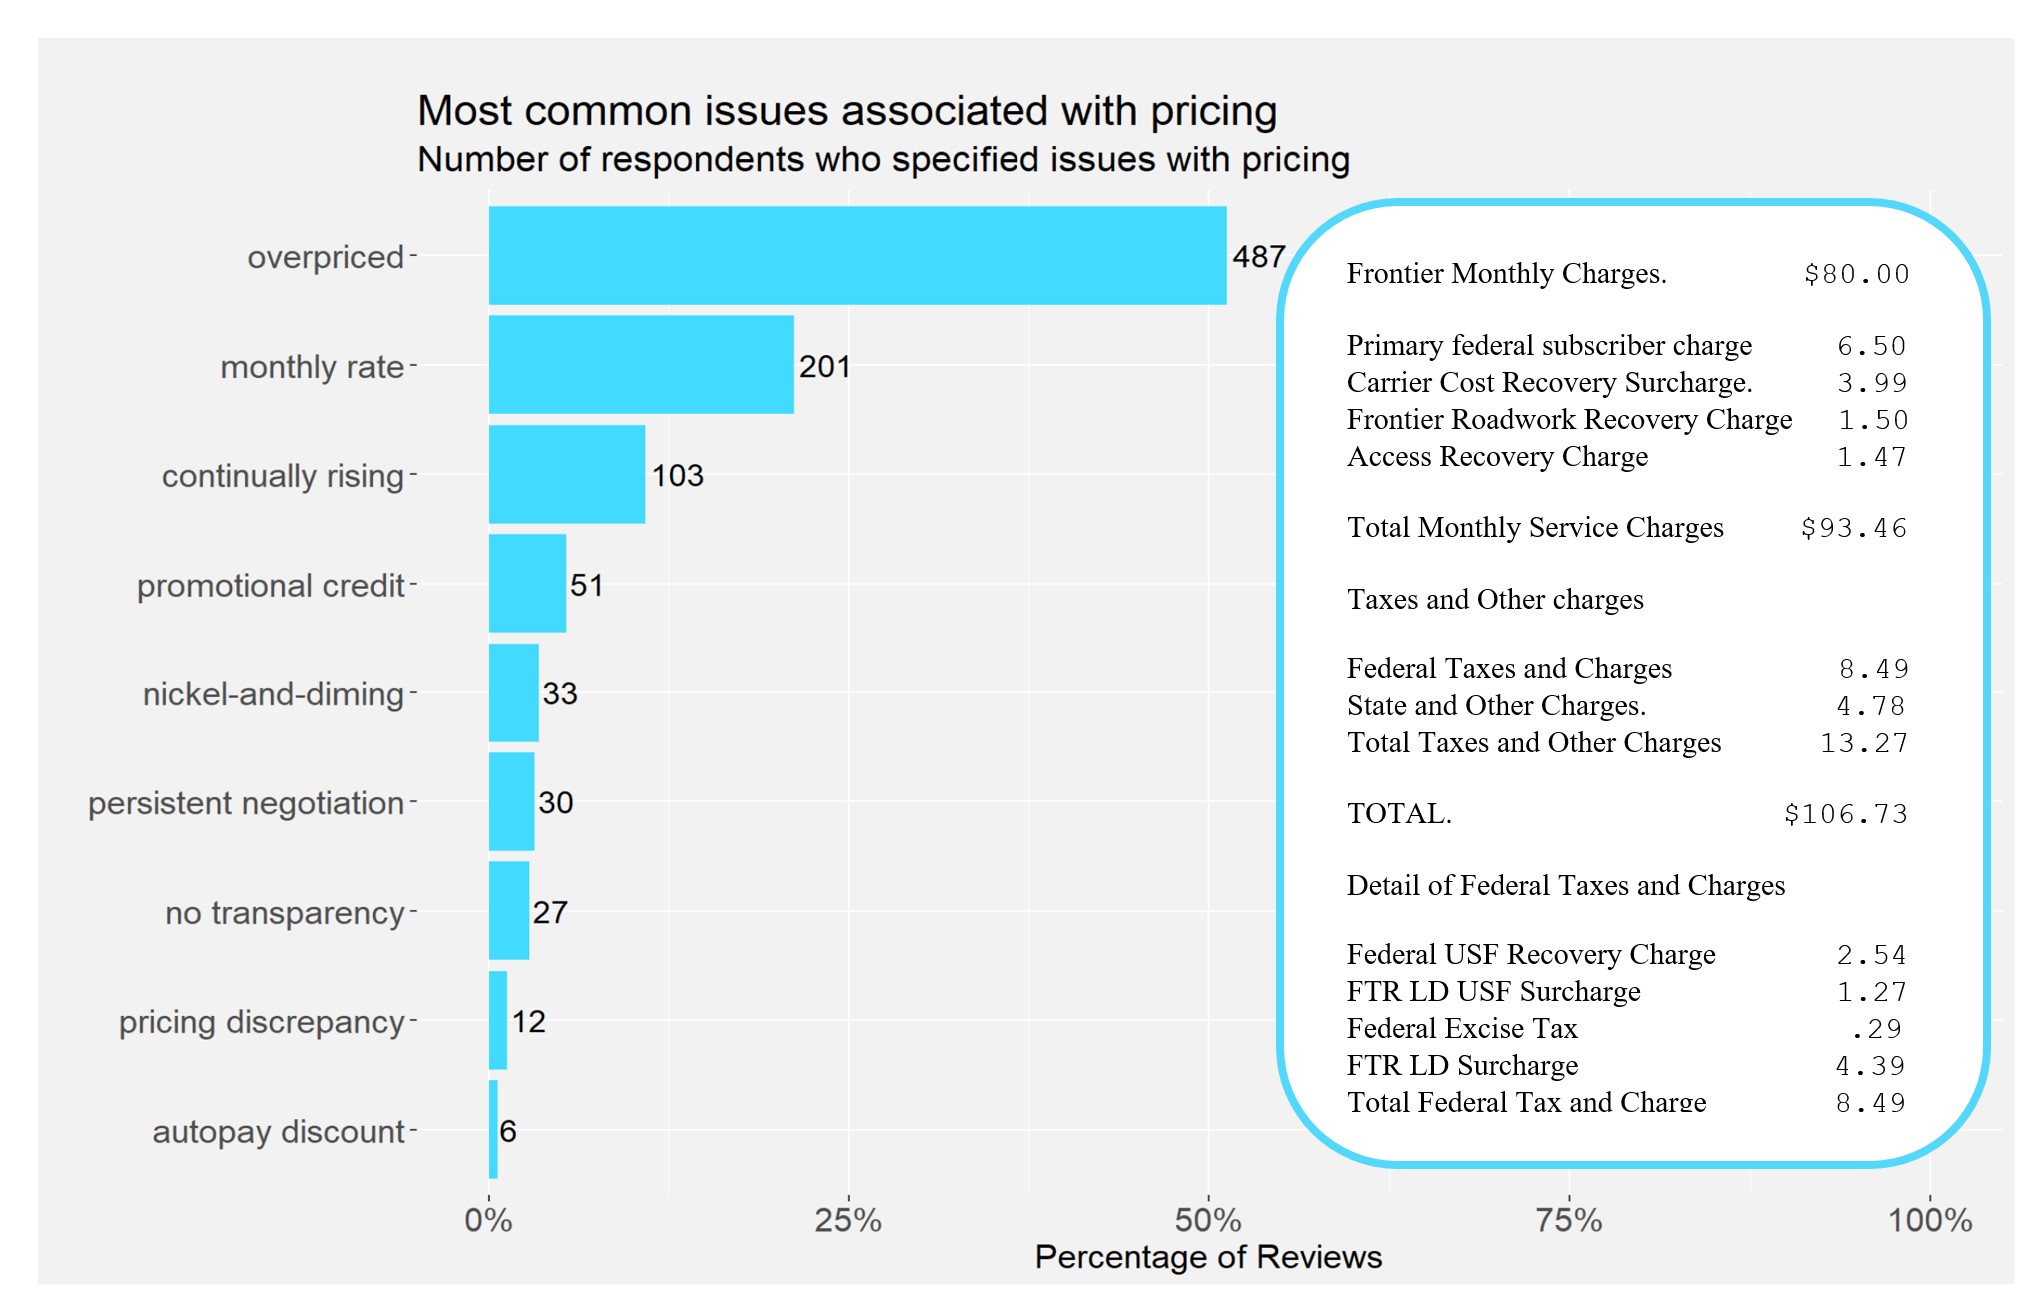
Figure 3, below, shows the number and percentages of unique consumer narratives that mention sub-issues related to pricing. For example, 487 stories described issues with unreasonably high pricing, and 103 described issues with continually rising rates. (Note that when a single narrative addressed multiple subtopics, it was counted in multiple bars.)
Figure 3 also includes a sample Frontier bill with itemized charges and taxes, including company-imposed fees such as a Road Work Recovery Charge, a company-imposed fee which some respondents complained about in their narratives.
Figure 3: Frequency of Stories Related to Pricing
Major Issue 2: Competition Concerns
The concern expressed with the second most frequency by respondents was the lack of competition between broadband providers and the respondents’ resulting lack of choice as purchasers of broadband service. Click on the soundbite below to hear from CR member, Annmarie Robert, in her own words from New Jersey.
At least 29 percent of stories raised this issue, with many of them stating or suggesting that the lack of competition is responsible for high rates or poor service because ISPs have little incentive to compete for their business when consumers are in a “take it or leave it” position.
“The only internet service that I can get at my place is HughesNet. It is a satellite-based internet, which is extremely slow. There are no other Internet providers in the area. When I need to communicate through zoom or download a video or streamline, I need to drive 11.5 miles to get better internet reception. I hope someday we will have broadband internet service in my area, which will help develop our local economy and better integrate our people to the rest of the nation.”
“I have no choice of providers where I live. Tv routinely goes out, too. Spectrum makes it extremely difficult to just get wifi, forces bundling. I can no longer afford to pay an exorbitant price for bad tv/phone/wifi service, especially when phone is not even a land line & cannot be used during emergencies! (We lose electricity all the time in my area) Why can’t I just get an affordable landline phone & wifi???”
Some CR members further reported that even when they ostensibly had a choice between two or more ISPs, the service offerings were not genuinely competitive with one another, in some cases because they didn’t offer comparable or equally useful services. Some respondents feel such practices make them captives of the companies and as a result, they believe internet access should be a public utility.
“There are basically 2 ISPs, Comcast/Xfinity or CenturyLink. Had Comcast for several years, and they wanted to increase our rate 40%. Just for a hook-up to the net they wanted $840 a year. We switched to CenturyLink and their service was a joke. When it was working it was slow, and after it went out three times in the first month my wife changed it back to Comcast. She is a teacher and needed reliable service to do what she needed to do online. This should be a public utility and we should actually get something for the taxes we pay.”
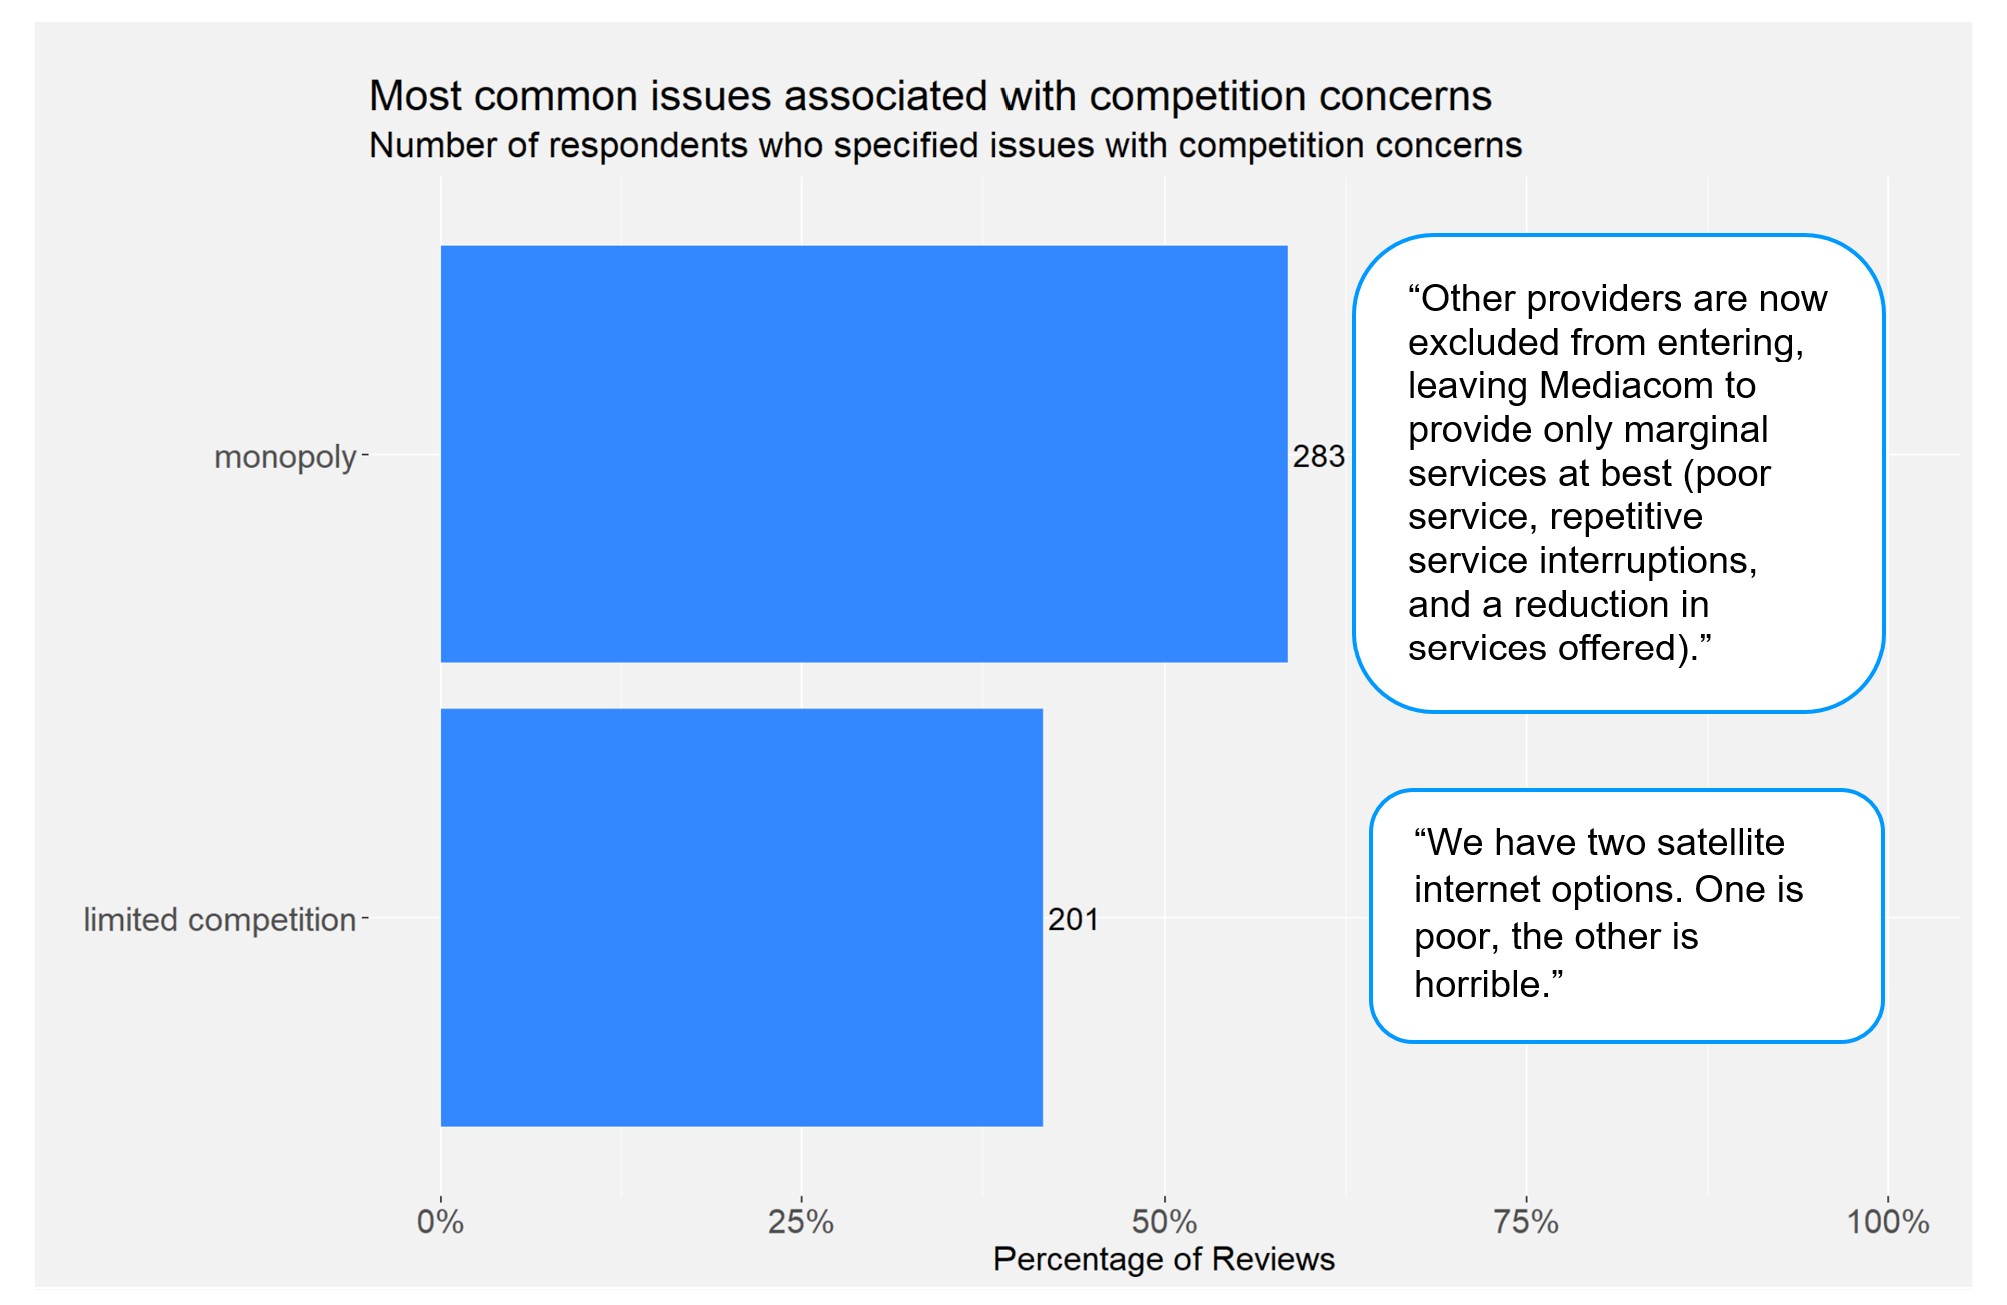
Figure 4, below, displays the counts and percentages of unique stories that mention competition concerns. Each bar represents the number of CR members who mentioned specific subtopics associated with the free market system. Of these stories, 283 described issues with monopolistic or anticompetitive practices and 201 described issues with having limited competition. Recall the same story may be counted in both bars since an individual story might mention both subtopics. Figure 4 also provides representative quotes supporting the specific subtopics.
Figure 4: Frequency of Stories Related to Competition Concerns
Major Issue 3: Connectivity Limitations
Another major concern expressed by CR members who shared their stories was about the quality of their internet services. As more and more people worked from home during the COVID-19 pandemic, CR members reported that network congestion amplified, thereby worsening connection issues. Click on the soundbite below to hear from CR member, Don Cole, in his own words from New Mexico.
“I have Verizon FIOS for TV, phone and internet service and pay almost $200/ month on a grandfathered deal including HBO, Showtime and Cinemax. They keep increasing the price but not the service. My DVR/cable box equipment is about 10 years old and they won’t replace it unless I “rent” for additional cost. Internet service is sketchy. At about 7 am and 3 pm every weekday it slows down, especially now since the pandemic.”
Furthermore, some respondents claimed what is advertised as broadband internet is anything but. For example, some shared their internet connection is often lost during peak hours, making things like video conferencing especially challenging during those times. Others reported having to resort to connecting their computer to their cell phone internet via a hotspot connection in order to complete daily tasks. Click on the soundbite below to hear from CR member, Karen Davis, in her own words from Georgia.
Numerous narratives also mentioned that ISPs are also “throttling” internet speeds after the consumer reaches a data cap despite the consumer paying for “unlimited” access. Still more consumers complained of inadequate service, low bandwidth, and high cost. Click on the soundbite below to hear from CR member, Lee Skornia, in his own words from Florida.
“Viasat has a 100GB data usage cap, after which they throttle us back to almost useless low speeds…so slow that, along with the terrible latency, we cannot stream anything, web pages load painfully slowly, and thus essentially have no way to add to data usage in any significant way. Viasat has horrifically oversold their capacity and despite their adverts, imposed a hard data limit. The service bogs down on good days, and becomes essentially useless when the data cap is reached and speeds are throttled down to highly variable speeds below 5m mbps.”
“$175/month for satellite internet. It’s slow and doesn’t work during a thunderstorm. The $175 price tag is for unlimited data which I have learned is not really unlimited – but cheaper than going over your limit on a Non-unlimited plan. There is a point on the data that they will throttle you down to where you will wish you had no internet.”
Figure 5, below, displays the counts and percentages of unique stories that mention connectivity limitations. Each bar represents the number of CR members who mentioned specific subtopics associated with connectivity limitations. Recall the same story may be counted in multiple bars since an individual story could mention multiple subtopics. Figure 5 also provides representative quotes supporting the specific subtopics.
Figure 5: Frequency of Stories Related to Connectivity Limitations
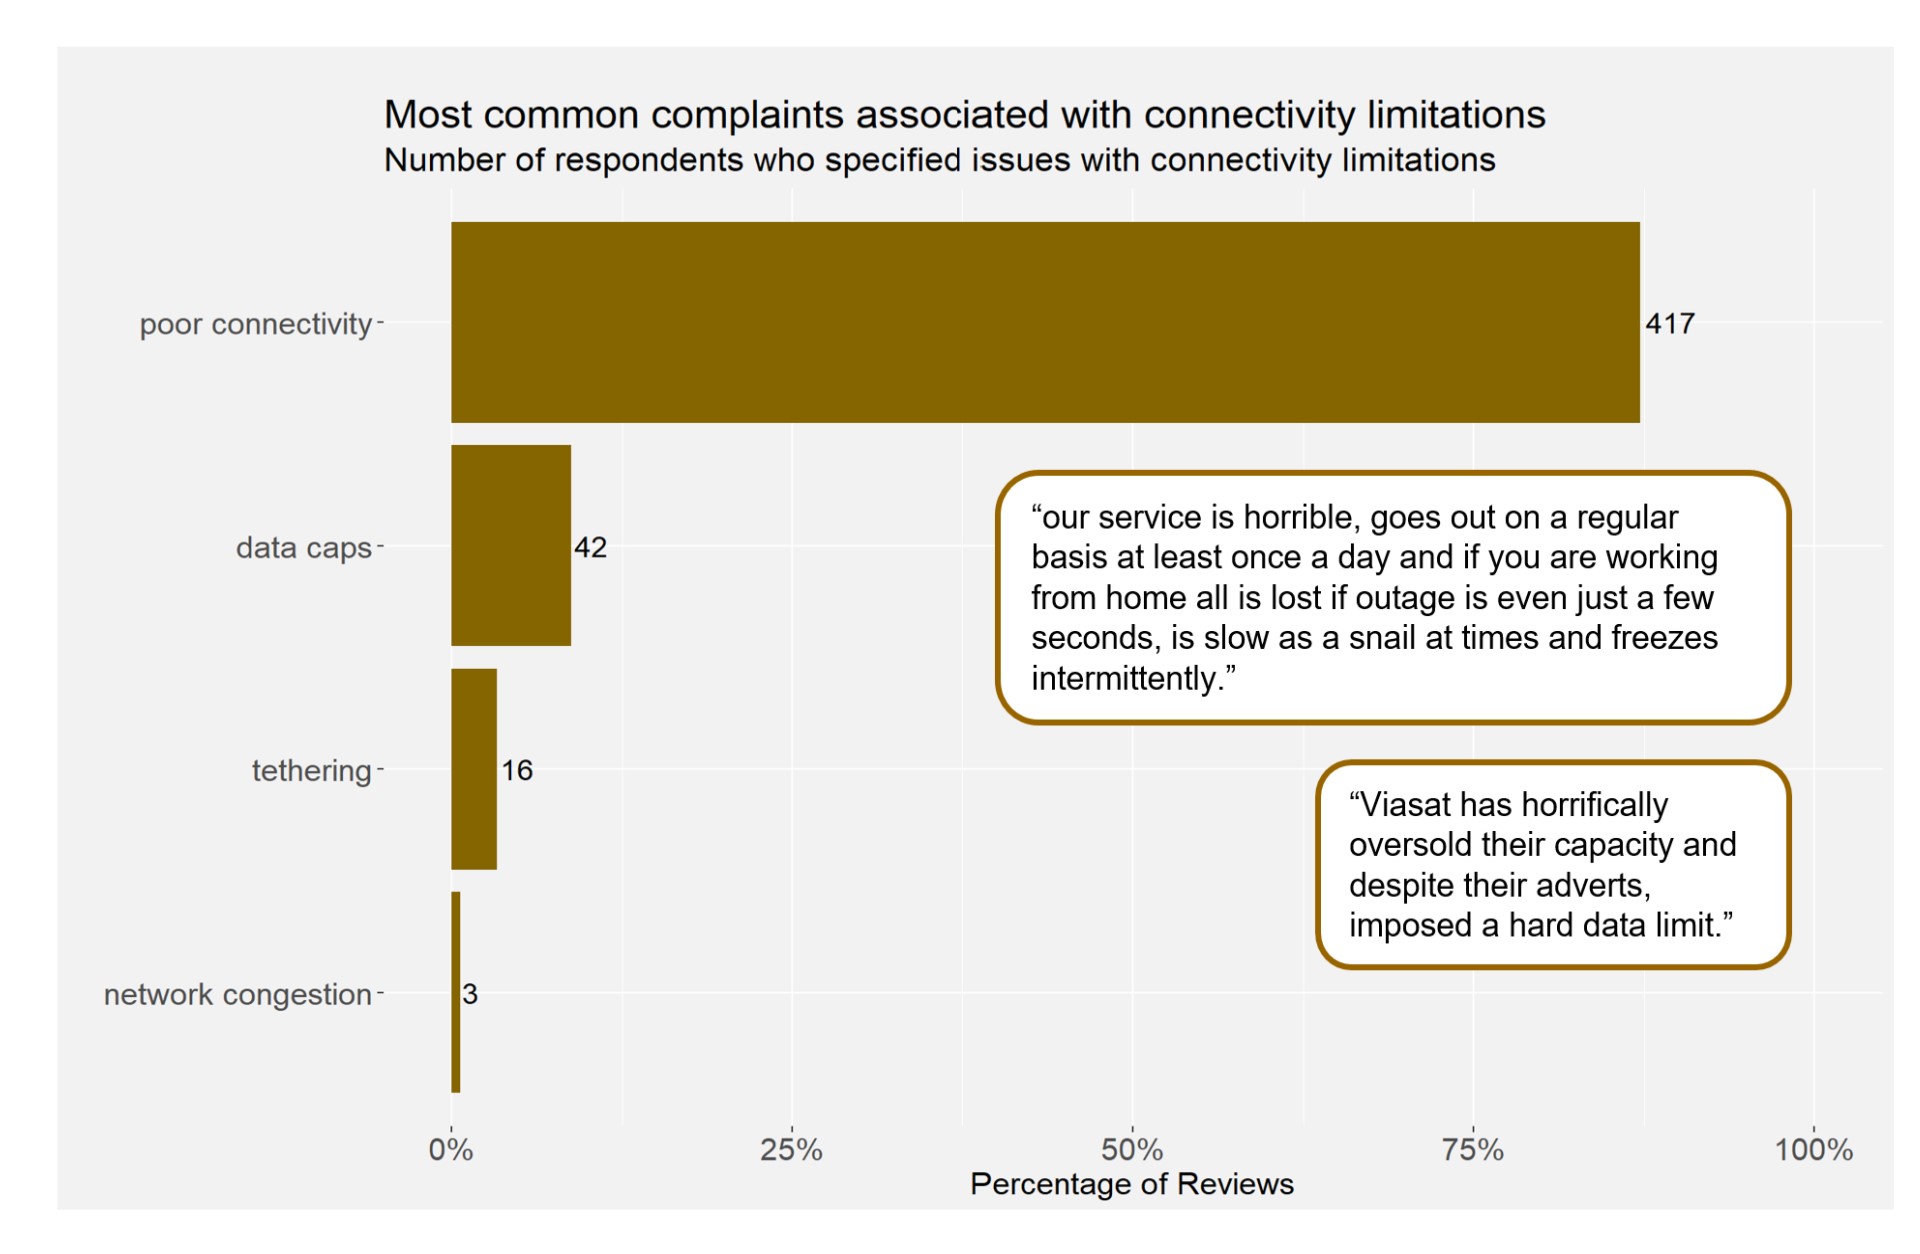
Figure 6, below, is an interactive chord diagram which shows the relationships between multiple major issues expressed by the respondents. The width of the bands connecting two issues is proportional to the number of responses that mentioned both issues. When hovering over a band, the number of stories that mentioned both issues is displayed.
Figure 6: Relationships Between Most Reported Issues
For example, the thickness of the light blue band connecting pricing and connectivity limitations indicates a relatively large number of stories that mention both of these issues. One of those stories we share below.
“I have internet through my tv provider, Frontier. It varies in speed and consistency and at least every few days disconnects, then reboots itself. In fact I just changed from 50/50 speed to 100/100. It actually seems slower than it was prior, and yet it is more expensive.”
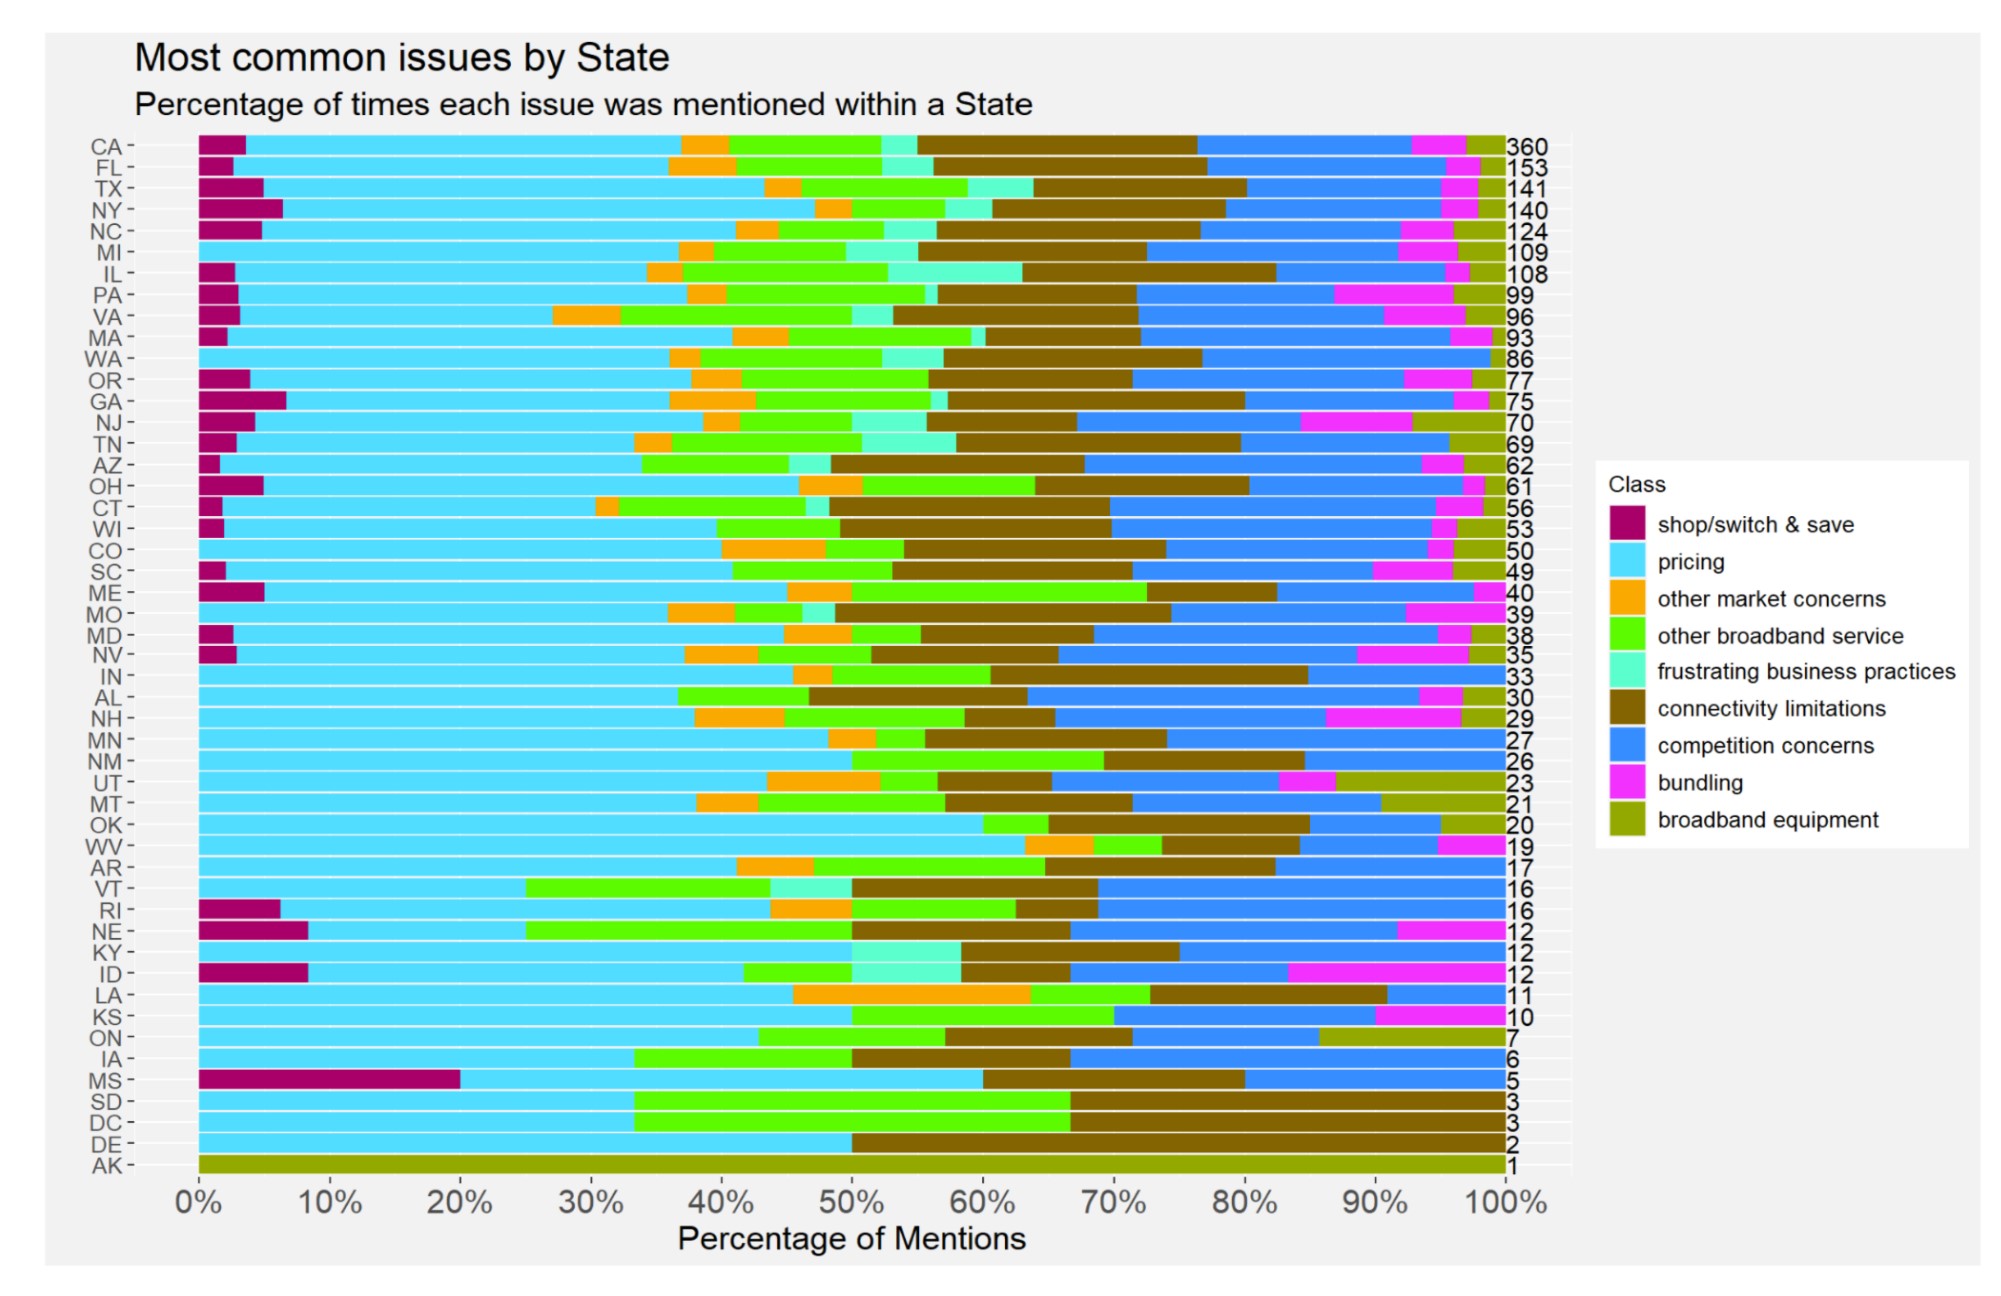
Geographical Analysis:
We received responses from CR members in 48 states across the country.
Figure 7, below, is a stacked bar chart representing the counts and percentages of unique sentences that discuss major issues within each state. Each bar illustrates the percentage of the total number of sentences in which an issue was mentioned, per state. The counts at the end of the bars indicate the total number of sentences derived from the state. For example, approximately 33 percent of the 360 sentences from California addressed pricing. Considering the entire chart, we see pricing makes up the largest proportion of sentences across the country, followed by competition concerns and connectivity limitations.
Figure 7: Proportion of Major Issues within Each State
Conclusion:
COVID has made us increasingly reliant on fast and reliable internet service. Consumer Reports analyzed more than 1,000 stories from our Share Your Story campaign regarding their experiences with broadband services during COVID. Many of the respondents felt that the business practices of ISPs during these challenging times are questionable at best and deliberately predatory at worst. CR is actively engaged with policymakers in Washington, D.C., and elsewhere to increase broadband access, affordability, competition, and price transparency to help mitigate the consumer harms described above.
As part of those efforts, Consumer Reports, along with a coalition of partners, is embarking on an ambitious project called Let’s Broadband Together to investigate the state of internet access in the U.S. CR will analyze thousands of consumer ISP bills from across the country to better understand what factors determine why and how ISPs charge the prices they do, and what information is and is not included in monthly bills. Go to broadbandtogether.org to participate, and share your bill today.
Acknowledgements:
We would like to express our sincere gratitude to the Consumer Reports team members who helped make this report possible: Dina Haner, Laurel Lehman, and Michael Saccucci.